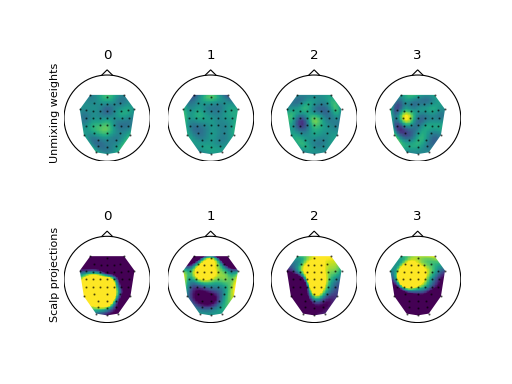
test example code: premixing.py
(Source code, png, hires.png, pdf)

# Released under The MIT License (MIT)
# http://opensource.org/licenses/MIT
# Copyright (c) 2013-2015 SCoT Development Team

"""
This example shows how to set the premixing matrix to tell the workspace about
pre-transformed data.
"""

import numpy as np
import matplotlib.pyplot as plt

import scot


# The example data set contains a continuous 45 channel EEG recording of a motor
# imagery experiment. The data was preprocessed to reduce eye movement artifacts
# and resampled to a sampling rate of 100 Hz.
# With a visual cue the subject was instructed to perform either hand of foot
# motor imagery. The the trigger time points of the cues are stored in 'tr', and
# 'cl' contains the class labels (hand: 1, foot: -1). Duration of the motor
# imagery period was approximately 6 seconds.
from scot.datasets import fetch


midata = fetch("mi")[0]

raweeg = midata["eeg"]
triggers = midata["triggers"]
classes = midata["labels"]
fs = midata["fs"]
locs = midata["locations"]


# Prepare the data
#
# Here we cut segments from 3s to 4s following each trigger out of the EEG. This
# is right in the middle of the motor imagery period.
data = scot.datatools.cut_segments(raweeg, triggers, 3 * fs, 4 * fs)

# common average reference
data -= np.mean(data, axis=1, keepdims=True)

# pre-transform data with a PCA
myunmix, mymix, data = scot.backend['pca'](data, 0.99)

print('Remaining data components:', data.shape[1])
print('Note that the Topoplots still map to all 45 EEG channels.')

ws = scot.Workspace({'model_order': 5}, reducedim=4, fs=fs, locations=locs)

# Perform CSPVARICA and plot the components
ws.set_data(data, classes)
ws.do_cspvarica(varfit='trial')

ws.set_premixing(mymix)

ws.plot_source_topos()
plt.show()
