In [69]: lines = plot([1,2,3])

In [70]: setp(lines)
  alpha: float
  ...snip

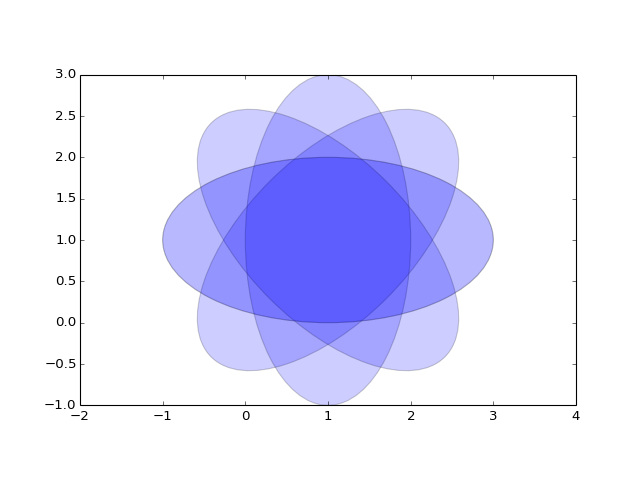
from pylab import *
from matplotlib.patches import Ellipse

delta = 45.0 # degrees

angles = arange(0, 360+delta, delta)
ells = [Ellipse((1, 1), 4, 2, a) for a in angles]

a = subplot(111, aspect='equal')

for e in ells:
    e.set_clip_box(a.bbox)
    e.set_alpha(0.1)
    a.add_artist(e)

xlim(-2, 4)
ylim(-1, 3)

show()
(Source code, png, hires.png, pdf)

(Source code, png, hires.png, pdf)

In [1]: x = 2

In [2]: x**3
Out[2]: 8
Blablablab blab bldrnuaie blubb.
In [3]: z = x*3
In [4]: z
Out[4]: 6
In [5]: print(z)
����������6
In [6]: y = z()
������������---------------------------------------------------------------------------
TypeError Traceback (most recent call last)
<ipython-input-6-4bd41ecc6fa3> in <module>()
----> 1 y = z()
TypeError: 'int' object is not callable
And some plotting?
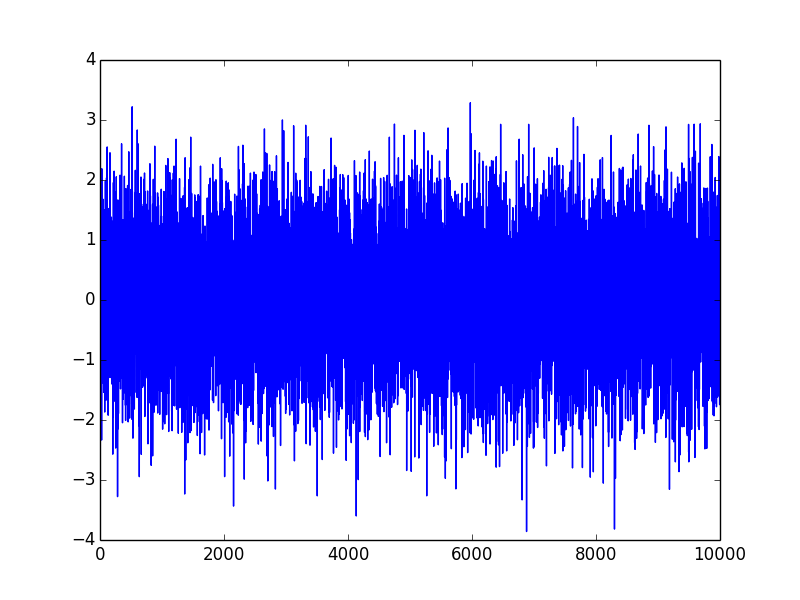
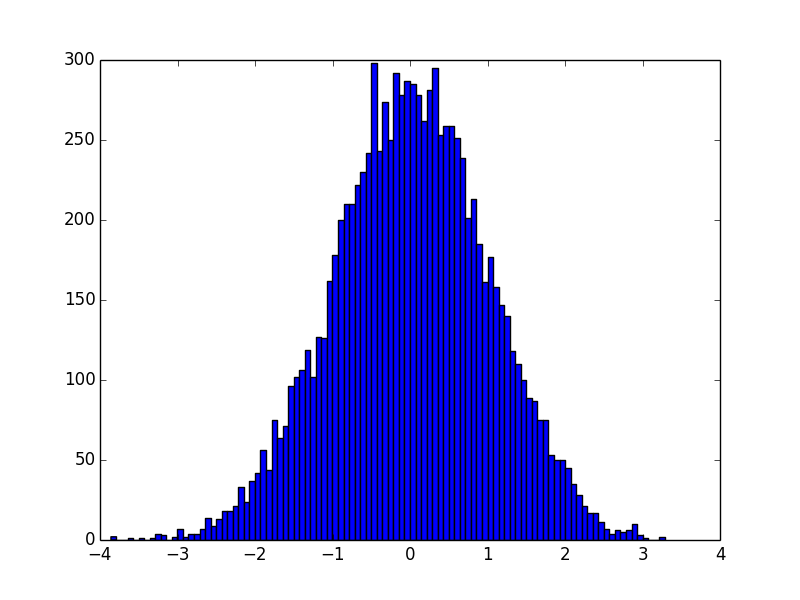
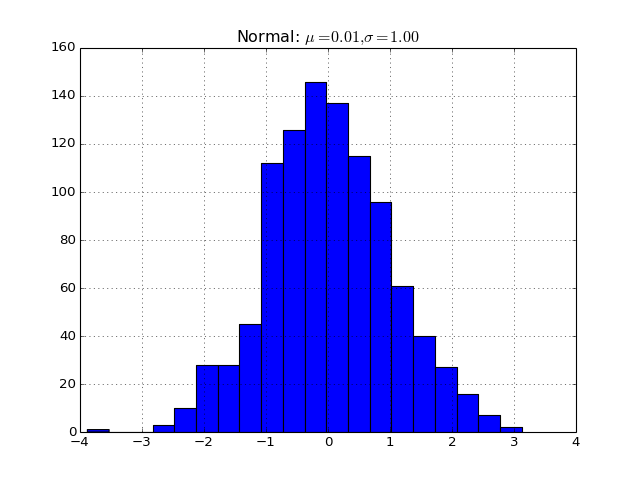
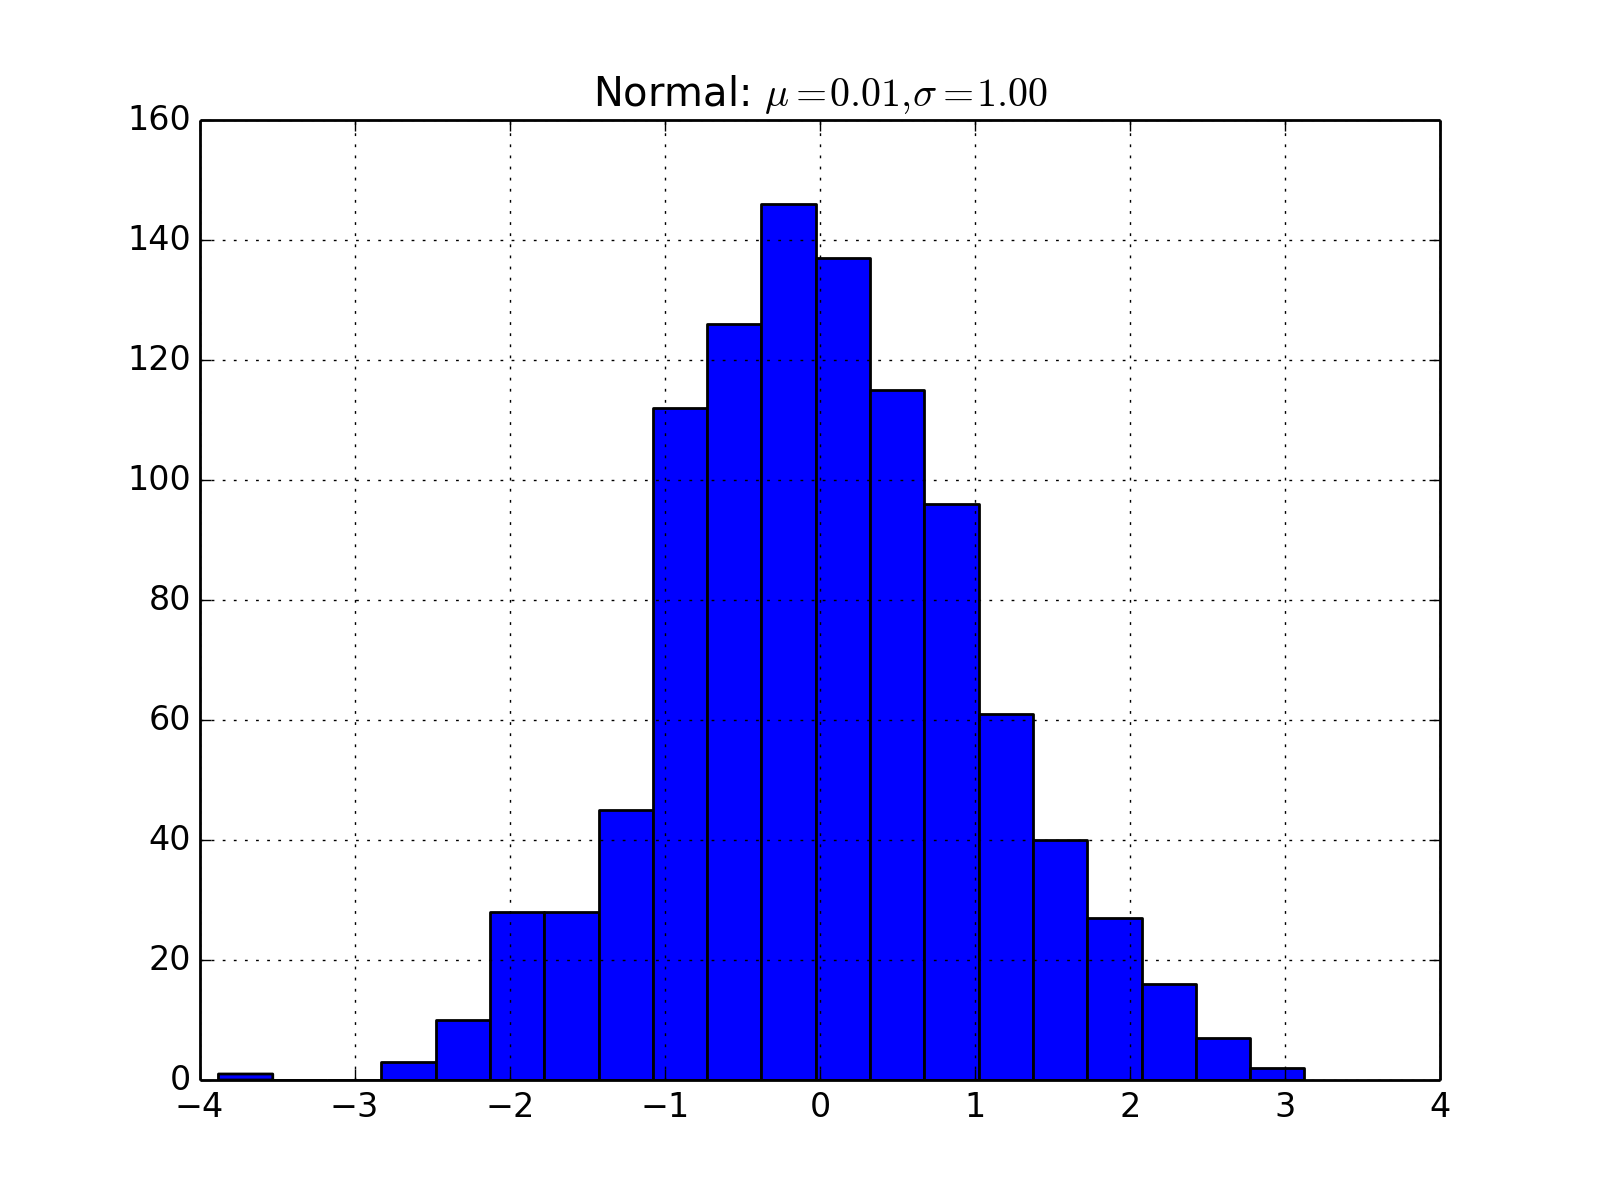
In [8]: data = np.random.randn(10000)

In [9]: plot(data);

In [10]: figure();

In [11]: hist(data, 100);